MLB Betting Systems for UK Punters: A Data-Led 2026 Playbook
By MLB Betting Systems Analyst
The first MLB ticket I ever wrote landed in my account at 04:17 GMT on a Wednesday. The West Coast game that paid me had finished a full hour after my alarm should have gone off. That single fact — an entire profitable sport in this country played while most of the population sleeps — tells you almost everything about why MLB betting systems in the UK look nothing like punting on the Premier League. Eight years of building, breaking and rebuilding baseball models for a British audience, and the lessons that survive share one root: the maths of baseball is unusually friendly to disciplined punters, but the calendar and the regulator make it unusually punishing for undisciplined ones.
MLB is a 162-game regular season, a sample size that crushes the noise floor of football or rugby. Run-scoring environments sit between 8 and 10 runs per game. The structural underdog wins roughly four games in nine. None of this is intuition; it is what eight seasons of tracked tickets eventually beat into you.
Moneyline — the simplest baseball bet, on which side wins outright, priced in decimal odds at every UKGC-licensed bookmaker.
UK punters carry a second layer the American guides never address. The UK Gambling Commission’s Industry Statistics put British gambling Gross Gambling Yield at £16.8 billion for the year to March 2025, with online sports and casino taking £7.8 billion of that. Affordability checks, a statutory levy and stake-rule reforms now sit on top of every bet at a British book. Pair that with a paid MLB UK fanbase estimated at around five million, and the picture is clear: a serious market on the consumer side, a tightening one on the regulatory side.
What follows is the playbook I would hand a new analyst joining my team. Organised by edge, not by market, because edges are what survive contact with a 162-game schedule.
Índice de contenidos
- The 2026 Playbook in 90 Seconds
- The UK MLB Market at a Glance
- What Counts as a Betting System
- UK Regulatory Context: UKGC and MLB Bettors
- Moneyline: The Baseball Foundation
- Run Line: The Structural Half-Run That Changes Everything
- First Five Innings: Isolating the Pitcher Edge
- Totals: Why the Ballpark Sets the Ceiling
- Weather: Wind, Temperature, and Edge
- Starting Pitcher: The Single Biggest Input
- Bullpens: Why the 7th–9th Innings Punish Favourites
- Underdog Systems: The 44% Edge Most Books Won’t Talk About
- Fading the Public: Where It Works and Where It Bleeds
- Bankroll: Kelly, Fractional Kelly and the UKGC Reality
- Closing Line Value: The Only Honest KPI
- Where to Go Deeper
- Betting Responsibly in the UK
- Frequently Asked Questions
- The Edge Compounds, the Discipline Carries It
The 2026 Playbook in 90 Seconds
- F5 and the run line are the two structural edges in MLB — both isolate inputs you can measure before the first pitch.
- Fractional Kelly staking, almost always half or quarter, is what stops a 162-game variance curve from emptying your bank.
- Park factors plus wind decide totals. Ignore them and you are betting blindfolded.
- UKGC 2025–26 reforms — affordability checks from £150 of net deposits, the statutory levy live since 1 September 2025 — change how a UK punter sizes bets, not whether they place them.
- Closing Line Value is the only KPI that does not lie to you about your edge.
The UK MLB Market at a Glance
When colleagues ask me whether MLB is «big enough» in Britain to bother modelling, I send them a single screenshot — Sky Sports’ deal page next to the BBC iPlayer «Bases Covered Live» listings — and let the picture argue for itself. The British baseball audience is no longer a curiosity, and the betting infrastructure has scaled accordingly. Six numbers I keep pinned above my desk.
£16.8 billion
UK gambling GGY for the year to March 2025, up 7.3% year-on-year.
£7.8 billion
Online casino, betting and bingo GGY in the same year, up 13.1%. This is where your MLB ticket actually lives.
£56.5 million
Direct economic impact of the 2024 London Series on the city, with 108,956 tickets sold across two games.
71.4 million
2025 MLB regular-season attendance — the third consecutive year of growth and the first such streak since 2005–07.
19.39 billion
Minutes streamed on MLB.TV in 2025, a 34% jump year-on-year.
5 million
Paid MLB fanbase in the UK by the league’s own count, with roughly 1.5 million classed as highly engaged.
Three reasons this compounds. A £7.8 billion online-betting pool means MLB markets on British books have meaningful depth — line shopping is rewarded because more than one shop competes for the same custom. The BBC’s 2025 summer slot pulled an audience without a previous baseball habit, thickening the live and futures books. And the London Series is now an annual data drop on how UK books price one-off MLB events. Not a niche any more, even if it still sleeps from 03:00 to 09:00 GMT.
What Counts as a Betting System
A junior analyst at my old desk once spent two months tinkering with a model and refusing to bet, on the grounds that he hadn’t yet «proven» it. I asked him what would count as proof. He couldn’t say. That is a tell. If you cannot define in a single sentence what would falsify your system, you do not have a system — you have a hobby with a spreadsheet.
Definition. A betting system is a pre-declared set of entry filters, a sizing rule, and an exit rule, all tested against historical data and applied without revision once the bet is placed. Three components, none optional. Remove the pre-declaration and you have hindsight; remove the sizing rule and you have a tip; remove the historical test and you have superstition.
Casual punters confuse three things: a strategy, a system, and a pick. A strategy is a worldview — «I bet F5 unders when the home starter posts sub-3.00 FIP». A system is that worldview committed to numbers — «stake 0.75% of bank on F5 under when home starter’s last-30-day FIP is below 3.00 and park run factor is 96 or lower». A pick is a single ticket. The system gives you the pick; you do not invent the pick and reverse-engineer the system.
Doug Upstone, a veteran handicapper whose work I read for a decade, has long argued a useful system needs to clear 75% over at least a five-year window. That bar is too high for plus-money markets, but the principle is right: five years is the minimum sample at which baseball randomness flattens.
Do
- Write your entry filters in a notebook the night before, not after the game.
- Log every ticket with the closing line, not just the price you took.
- Run a paper backtest covering at least three full MLB seasons.
- Define one explicit «kill» condition — a drawdown or sample size that retires the system.
Don’t
- Change a filter halfway through a losing run to «rescue» the system.
- Add a new filter every time a bet loses.
- Confuse a hot week with a working edge.
- Mix systems on the same ticket without separating their stakes.
Pedantic is how you stay solvent.
UK Regulatory Context: UKGC and MLB Bettors
I had an account frozen in September 2025 — three days, no MLB action, a polite email asking for two months of bank statements. The trigger was not a five-figure deposit; it was a rolling £400 of net top-ups across a fortnight. The regulator did not invent this; it published it. Most British punters discovered it the hard way.

The UK Gambling Commission is now embedded in the operational mechanics of every UKGC-licensed bookmaker. Total gambling GGY hit £16.8 billion for the year to March 2025, and Andrew Rhodes, the UKGC’s chief executive, framed it at ICE 2025 by noting participation was holding stable while GGY hit «the highest GGY we have ever seen». Stable participation with rising yield means more revenue per active account — exactly the pattern regulators tighten into.
The tightening lives in three concrete reforms. The light-touch financial vulnerability check activates at net deposits of £150 over a rolling thirty-day window. The statutory levy on operator GGY went live 1 September 2025. The slot-stake ceiling does not touch sports betting directly but has shifted operator risk appetite and therefore market depth.
The Commission estimates roughly 3% of all active gambling accounts will eventually fall under a financial risk assessment. Three per cent sounds small until you remember a serious MLB punter sits well above the median behaviour pattern that 3% is drawn from. Plan as though it applies to you.
EY put the annual industry burden of running affordability checks at over £125 million. The translation: do not deposit in lumpy spikes, do not chase losses with sudden top-ups, keep stake-to-deposit ratio sensible. Books are looking for irregularity, which is easy to avoid if you have a system.
What this means for MLB specifically. Rhodes flagged UK punting in 2025 as widening «beyond the traditional horseracing and football», with cricket, basketball, NFL and «a host of other US-based sports» growing. MLB sits inside that category. Good news on legitimacy and indifferent news on regulatory pressure — the rules apply identically whether your ticket is on the Yankees or the Saturday football coupon.
None of this should change which bets you place. It should change how you stake them.
Moneyline: The Baseball Foundation
If you have never bet baseball before, the first time you see a price written as «-150 / +130» you will assume the bookmaker’s website has broken. American odds look hostile to anyone raised on UK decimals, and the friction is real enough that it is the single most common reason new British punters bounce off baseball after one session.
The moneyline is simply who wins the game, full stop, no handicap. Extra innings count. The pitcher who started for either team is irrelevant to settlement unless you specifically asked for «listed pitchers» on the slip. Because baseball games are roughly coin-flips, MLB moneylines cluster in a narrow band — most trade between -180 and +160 on the favourite.
| Market | American | Decimal (UK) | Implied probability |
|---|---|---|---|
| Heavy favourite | -200 | 1.50 | 66.7% |
| Moderate favourite | -150 | 1.67 | 59.9% |
| Light favourite | -115 | 1.87 | 53.5% |
| Light underdog | +105 | 2.05 | 48.8% |
| Plus-money dog | +140 | 2.40 | 41.7% |
Implied probability shown without the bookmaker overround removed.
Implied probability — the win rate a price is «asking you to believe in» before margin. 1.67 decimal asks for 59.9%; if your model says 63%, the bet has expected value.
Every UKGC-licensed book shows MLB lines in decimal. I do not bother with fractional for baseball; the conversion to expected value is slower and the precision worse. Decimal lets you read implied probability almost at a glance — divide one by the decimal price, multiply by one hundred. The only piece to memorise: 2.00 is exactly 50% before margin.
The moneyline is the foundation on which the run line, the F5, the totals and the props all rest. Master this table and the rest unlocks.
Run Line: The Structural Half-Run That Changes Everything
The most expensive education I ever paid for came from a single Tuesday in May 2019 — Astros heavy favourites against the Tigers, I took -1.5 at short odds because the price looked «stolen», and the Astros won 2-1 in the eighth. My moneyline ticket would have cashed; my run-line ticket was scrap paper. That distinction — winning the game while losing the run line — is what makes the run line not a discount on the moneyline but a different bet entirely.
The run line in baseball is a fixed 1.5-run handicap. The favourite has to win by two or more; the underdog can win outright or lose by exactly one and still cover. Roughly 30% of all MLB regular-season games end with a one-run margin — three in ten flip the run line away from the moneyline result.
| Market | Moneyline | Run line -1.5 |
|---|---|---|
| What you bet on | Outright winner | Margin of victory ≥ 2 runs |
| Typical favourite price | 1.50 to 1.90 | 2.05 to 2.50 |
| Settlement on a 4-3 win | Cash | Lose |
| Settlement on a 6-1 win | Cash | Cash |
| Best deployed when | You have a clear winner read | You have a clear margin read driven by pitching mismatch |
The conceptual difference matters more. A moneyline edge can come from any source. A run-line edge requires a specific shape — either a blow-out mismatch (taking -1.5 on a dominant favourite with a weak opposing bullpen) or a tight defensive matchup that protects a +1.5 underdog. Mistake the first situation for the second and you bleed.
The run line is not a «value version» of the moneyline. Heavy-favourite shoppers love it because the price looks generous; in practice the 30% one-run rate is what eats them.
First Five Innings: Isolating the Pitcher Edge
Ask any handicapper who actually makes money on baseball what their highest-volume market is, and a disproportionate number will give you the same two letters: F5. I include myself. Roughly 40% of my MLB ticket count in 2025 sat on first-five-innings markets, and the win-rate on that subset outperformed my full-game tickets enough that I have spent a lot of time working out why.
The reason is mechanical. A first-five-innings bet settles on the score at the end of the top of the fifth inning, before the bullpens take over. That cut-off removes the largest source of late-game variance in baseball: relief pitching. Removing them strips out a layer of noise that has nothing to do with the inputs you actually modelled.
| Dimension | Full game | First five innings |
|---|---|---|
| Who decides the result | Both starters, both bullpens, both managers | Almost entirely both starting pitchers |
| Innings of exposure | 9+ (extra innings count) | 5 |
| Pinch-hit risk | High late | Negligible |
| Extra-innings risk | Yes | None |
| What you are actually betting on | The whole game | The starting-pitcher matchup |
The numbers are striking. A team with the superior starting pitcher wins the F5 segment in roughly 57% of games versus 59% for the full game — slim until you realise the F5 number lives at a much tighter line price, making effective expected value substantially better. And teams leading after five innings go on to win the game about 85% of the time.
F5 versus full-game break-even maths
F5 moneyline on your favoured side at 1.95 decimal. Implied probability: 1 / 1.95 ≈ 51.3%.
If your model says the superior starter wins the F5 in 57% of cases, edge over break-even is 5.7 percentage points.
At a flat 1% stake of a £1,000 bank, that edge over 200 tickets translates to expected profit of roughly £55.
Three caveats. The line is tighter — bookmakers margin F5 harder in some shops. Some books cancel F5 bets if either starter is scratched. And F5 totals behave differently from full-game totals because the bullpen scoring contribution is gone.
If you are building a system for the first time, start with F5. Lower variance, cleaner pitcher inputs, faster feedback loop.
Totals: Why the Ballpark Sets the Ceiling
There is a ballpark in Sacramento, opened by necessity in 2025 because the Athletics needed somewhere to play while their Las Vegas stadium is built, that quietly turned in the most extreme one-season run-environment shift the league has seen in years. Sutter Health Park yielded roughly +10% more runs and +5% more home runs than league average across its inaugural season. If you didn’t know about that on opening day, your Athletics totals model lost you money for the entire summer.

Park factors are the multipliers analysts use to describe how each stadium amplifies or dampens scoring. A park factor of 105 means runs are scored 5% more often than baseline; 95 means 5% less. Most parks sit between 92 and 108 — narrow until you remember it operates on the total line, where a 9.0 baseline at a 108 park becomes 9.7 expected runs.
Four parks every UK punter should memorise as anchors.
| Park | Tendency | Why |
|---|---|---|
| Coors Field (Colorado) | Extreme over | Altitude reduces air density, balls carry further and breaking pitches flatten |
| Sutter Health Park (Sacramento) | Strong over | 2025 debut posted +10% runs and +5% HR versus league |
| Kauffman Stadium (Kansas City) | Mild under | Largest park by outfield area; wind subtracted more HR here than anywhere else in 2023–24 |
| Citi Field (Mets) | Wind-aided over | Top park for «gifted» home runs by wind across 2023–24 |
This is where totals systems live or die. The over/under market is the most popular MLB bet for casual punters because overs are emotionally easier than unders. Bookmakers know this. The juice on the over is frequently shorter than the under in hitter-friendly parks where public money piles in.
The honest framework: park factor first, weather overlay second, starting-pitcher quality third, bullpen depth fourth, lineup health fifth. Skipping the park factor is the most common mistake I see in semi-amateur models.
If you remember nothing else: the ballpark sets the ceiling on scoring before the players take the field.
Weather: Wind, Temperature, and Edge
The single most useful sentence I ever read about baseball physics came from Dr. Alan Nathan: «Adding a mere 5 mph worth of wind behind a ball can add nearly 19 feet of travel distance.» Five miles per hour adds enough distance to turn a deep flyout into a home run.

Weather is not a separate strategy in MLB. It is a filter that sits on top of totals and home-run props. Warmer air is less dense, less dense air resists the ball less, the ball travels further. Wind adds or subtracts directly. Altitude is the extreme — Coors plays the way it does because Denver sits a mile above sea level.
Games with wind blowing out produce around +5.8% more runs and +7.6% more home runs than games with neutral or inbound wind. A 10 mph tailwind adds roughly 19 feet of distance; a 10 mph headwind can cut home-run output by as much as 33%. Every additional 10°F of temperature adds approximately 1% to ball-flight distance, with another 1% per 800 feet of altitude.
Three operational rules.
First, build a weather check into your totals system as a hard filter. My rule, survived four seasons of testing: if the park run-factor is 105 or higher and forecast outfield wind is 8 mph or more out, the over filter activates; if the park factor is 95 or lower and wind is in, the under filter activates. Both still require pitcher and lineup confirmation.
The temperature angle UK punters miss. April baseball in Chicago, Boston and Minnesota plays cold, often below 50°F, suppressing home runs. June and July at the same parks hits in the 80s and the distance equation flips. The home-run prop market often lags this shift by a fortnight every spring — the cleanest seasonal edge in the calendar.
Second, treat wind direction as a binary — «out», «in» or «cross», not compass headings. Cross-winds at Wrigley specifically can suppress or boost depending on whether they push balls into the gaps or the bleachers.
Third, ignore weather for F5 markets unless wind is extreme. Five innings is not long enough for marginal temperature to swing the result.
Weather is not anecdotal. It is a measured, repeatable input the public consistently underweights. Read the forecast before the lineup.
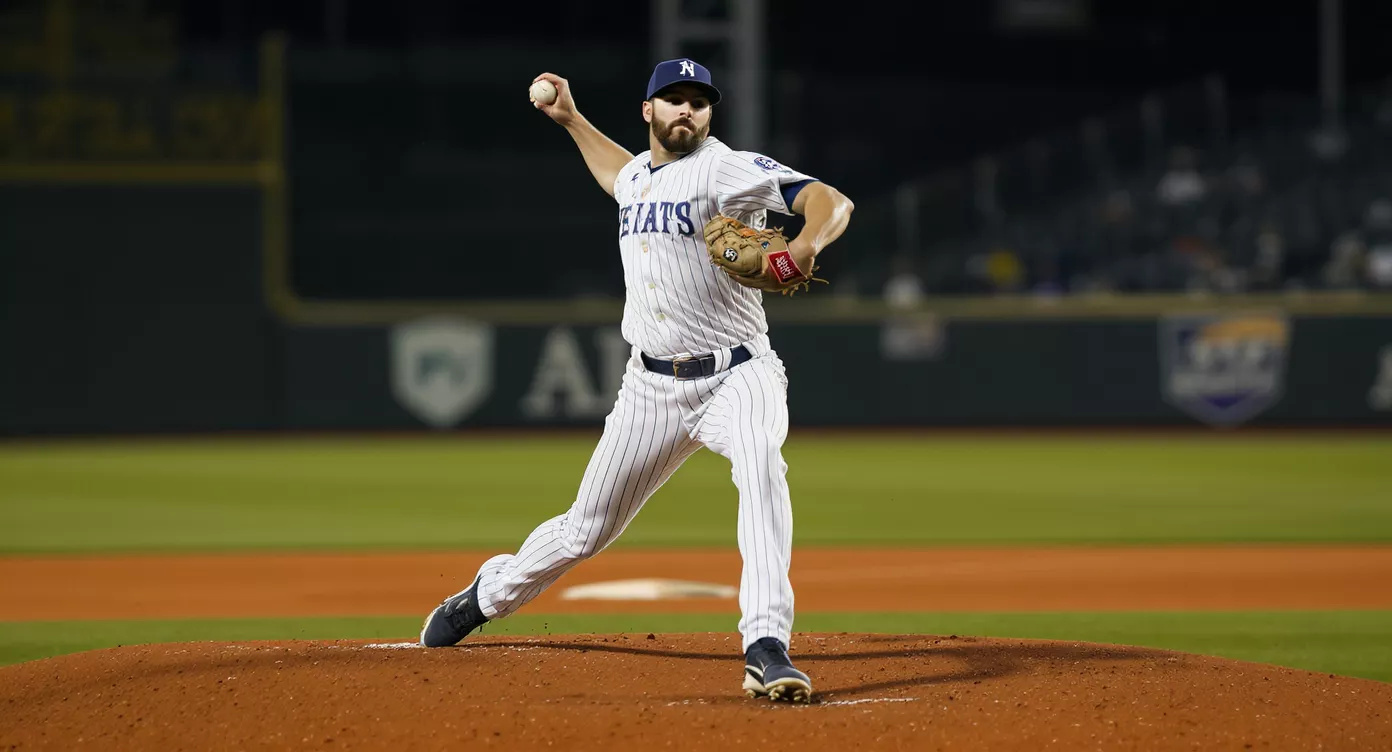
Starting Pitcher: The Single Biggest Input
Here is a question I sometimes use at interviews: a starting pitcher walks into the season with a 4.50 ERA after three appearances. Is he good or bad? Junior analysts answer «bad». Senior analysts answer «I don’t know yet». The starting pitcher is the single most important variable in any MLB bet, and the metric most people lean on is the one most likely to mislead them.
ERA is a results metric, and results metrics are noisy at small samples. A 4.50 ERA across three starts can hide a pitcher who has been excellent and unlucky; a 2.00 ERA can hide one who has been mediocre and well-defended. The metrics that survive the noise are built on inputs the pitcher controls directly.
The three numbers that matter, in order.
- K-BB% — strikeout rate minus walk rate. The single best one-number predictor of pitcher value. Anything above 20% is elite.
- FIP — fielding-independent pitching. Estimates ERA with defence and luck neutralised. Built only on strikeouts, walks, hit-by-pitches and home runs.
- xFIP — expected FIP, which normalises home-run rate to league average. Useful for filtering unsustainable homer luck.
SwStr% — swinging-strike percentage. Tracks strikeout potential weeks before the strikeout rate catches up.
If you have access to Statcast — Baseball Savant publishes it free — layer in expected statistics that strip out luck. xERA tells you what a pitcher’s ERA «should» be based on contact quality. xwOBA against tells you the same from the hitter side.
Paul Skenes’s 2025 season is a useful reference. He finished with a 1.97 ERA — the first qualified pitcher under 2.00 at age 23 or younger since Dwight Gooden in 1985 — and the underlying FIP and xFIP backed up the surface number. That alignment separates a sustainable ace from a hot-streak fluke.
Operational rule: never bet a pitcher purely on his ERA. The market does that, and it is wrong often enough that you can fade it when the underlying inputs disagree. Two more notes. Recency matters more in baseball than in any other major sport — a pitcher’s last six starts are a stronger signal than career numbers. And the platoon split is enormous and almost always underweighted; if your model ignores handedness you have not started yet.
Bullpens: Why the 7th–9th Innings Punish Favourites
If you want to know why the F5 market exists at all, look at any Sunday box score in late August and count the pitching changes. A typical full game in 2025 used between four and six pitchers per side, and the back end of that bridge is where the favourite who looked safe through six often loses by one.
The bullpen is the second-largest variable in MLB, and structurally the noisiest. Relief pitchers throw fewer innings per appearance, so their underlying stats stabilise more slowly than starters’. A reliever with a 1.50 ERA across 18 innings might be genuinely elite or might have run a sequence of high-leverage outings against weak lineups. The same metrics — K-BB%, FIP, SwStr% — work for relievers, but samples are smaller and league turnover is faster.
Three operational rules.
First, bullpen usage compounds. A relief corps that pitched four innings on Saturday and three on Sunday is not the same unit on Monday. Most clubs publish availability charts before first pitch, and the savvier UK punters track cumulative pitch count over the last three days as a hard filter. A favourite whose closer is unavailable is a different bet.
Second, manager tendencies are measurable. Some go to their best reliever in the seventh regardless of leverage; others save him for the ninth. The differences produce consistent edges if you track them across a season.
Third, pinch-hit and double-switch decisions distort full-game player props. A home-run prop priced at 1pm assumes the batter receives all four plate appearances; pull him for defence in the seventh and he gets three. F5 props bypass this entirely.
Bullpen volatility is the reason F5 markets carry tighter pricing than full-game markets, and the reason «best bet» lists on most affiliate sites carry depressing long-term ROI. The seventh, eighth and ninth innings are where the noise lives.
Underdog Systems: The 44% Edge Most Books Won’t Talk About
A statistic that has paid for more of my dinners than any other in baseball: MLB underdogs win roughly four games in nine over a long enough sample. Forty-four per cent. Read that again, because it is the single largest counter-intuitive fact in the sport.
Compare football, where favourites win around 70% of one-sided fixtures, or basketball at 67%. A baseball game where one team is a -150 favourite still leaves the underdog winning the actual game well above two times in five.
The break-even maths. A +120 underdog price needs to win 45.5% of the time to break even before margin. A +130 needs 43.5%. A +140 needs 41.7%. If the baseline underdog wins ~44%, the typical plus-money price sits almost exactly at the break-even line — meaning even a small selectivity filter tips you into long-term profit.
That last sentence is the entire underdog philosophy in one line. You do not need to be clever. You need to be selective.
Plus-money break-even illustration
200 +130 underdogs at flat £20 per ticket, total turnover £4,000.
At a 44% baseline win rate: 88 wins × £20 × 1.30 = £2,288 profit returned; 112 losses × £20 = £2,240 lost.
Net expected profit: roughly £48 across 200 tickets — a 1.2% ROI with no filter.
Add a modest filter — only fade favourites whose starter has FIP above 4.00 — and ROI typically lifts to 3–5%.
The filters that work are simple. A quality opposing starter against a mediocre favourite starter; a bullpen-rest mismatch favouring the underdog; a park factor that suppresses scoring (compressing favourite advantage); a road favourite playing a day game after a night game. Layer two or three of those and you start seeing tickets cash meaningfully above 44%.
What does not work is betting underdogs blindly. The 44% number is a baseline; the filter does the lifting. Casual punters either avoid plus-money tickets entirely or bet them indiscriminately. The middle ground — disciplined plus-money betting with a written filter — is where the most consistent UK MLB punters make their bank.
Fading the Public: Where It Works and Where It Bleeds
«Bet against the public» is the loudest advice in baseball betting and the one that, applied lazily, will lose you the most money. Fading consensus only works in specific market conditions, and most punters who try it have not learned which.
The intuition is straightforward. When 80% of money on a market goes one way and 80% of bets go the same way, the bookmaker has not had to move the line — the favoured side is priced exactly where the public wants it. When 80% of bets back one side but only 55% of the money is on it, the picture is different: sharper money is on the unpopular side and the line has moved to reflect it. That is the situation where fading the public actually means fading the recreational money.
The three contrarian setups that pay over a season.
- Heavy primetime favourites. ESPN’s Sunday Night Baseball draws disproportionate casual money on the better-known team. The line shortens. Plus-money underdog tickets in nationally televised games clear above the random baseline.
- Public-favourite home teams after a high-scoring day. Casual money assumes «hot offence carries forward» — it almost never does at the team level over a single game.
- Late-line move against the favourite. If the price drifts away from the favourite in the last hour despite the public still piling on, sharp money is on the other team.
What does not work is the lazy version: «70% of tickets are on the Yankees, so I bet the other side». Bet percentage without money percentage is meaningless. A serious UK punter either subscribes to a feed that publishes both metrics or accepts fading the public is not a clean system for them.
Treat contrarian betting in MLB as a tiebreaker between two otherwise equal candidate bets, not a system in its own right.
Bankroll: Kelly, Fractional Kelly and the UKGC Reality
The Kelly Criterion is the most misused formula in sports betting. Applied properly, it is also the most important piece of maths a serious MLB punter ever learns. Full Kelly recommends stake sizes large enough to bankrupt almost everyone who uses it; cutting it down is what separates surviving punters from cautionary tales.

The Kelly formula
f* = (bp − q) / b
where f* is the fraction of bank to stake, b is decimal odds minus 1, p is your estimated win probability, and q is 1 − p.
Worked example. A +130 underdog (decimal 2.30), model says wins 48%.
b = 1.30, p = 0.48, q = 0.52
f* = (1.30 × 0.48 − 0.52) / 1.30 = 0.104 / 1.30 ≈ 0.08
Full Kelly says 8% of bank. On a £2,000 bank that is £160 on a single ticket — the kind of stake that wipes a punter out during a normal cold streak.
Fractional Kelly is the answer. Half Kelly halves the stake; quarter Kelly quarters it. Expected growth drops, but variance drops more. For baseball — where 162 games virtually guarantees losing streaks of seven or more — quarter Kelly is what I recommend for any punter not running professional bankroll-volume. Kelly assumes your win-probability estimate is exact, and it never is; quarter Kelly buys robustness.
The UK angle adds a layer. The light-touch financial vulnerability check triggers at £150 of net deposits over a rolling thirty-day window. A disciplined fractional-Kelly punter who deposits once and rarely tops up sits well under that trigger. A punter who deposits £50 weekly to cover losses hits it inside three weeks. Maths and regulation aligned.
Pre-bet checklist
- Have I written down my win probability before I saw the price?
- Does the decimal price exceed 1 / my probability?
- What does quarter Kelly say my stake should be?
- Have I confirmed lineup, listed pitchers and weather in the last hour?
- Have I logged the closing line I would compare this stake against?
- Is this stake inside my monthly deposit pattern?
If any one of those six is «no», the ticket does not go on. That single rule has saved me more money than every model improvement combined.
Closing Line Value: The Only Honest KPI
If you ask me what single metric tells me whether a punter actually has an edge, I do not look at his win rate or his profit-and-loss. I look at his Closing Line Value, across at least three hundred tickets before I will call the result reliable.
Closing Line Value — the difference between the decimal price you took on a bet and the decimal price the market closed at on the same outcome. Positive CLV means you beat the market’s final consensus.
Results in baseball are noisy enough that you can run a 55% win rate over fifty tickets and still have no edge. Closing Line Value is much harder to fake. If you consistently take prices the market moves towards, the market is telling you your reads are aligned with the sharper consensus. The wins follow.
How to measure CLV as a UK punter. Pinnacle is the recognised «sharp» book; its closing line is the cleanest market consensus available. Log the decimal price you took at your UK book, then log the Pinnacle decimal price at first pitch. Convert both to implied probability and compare. Averaged across hundreds of tickets, that difference is your CLV. A persistent +1% to +2% is long-term winner territory; +0.5% is honest; below zero is the market telling you something.
This is also where line-shopping pays. The same MLB market at three different UKGC books frequently shows a 0.05–0.10 spread in decimal odds — marginal on a single ticket, significant across a thousand. A punter who takes the best of three quotes has built CLV into the workflow before placing a single bet.
Most punters who think they have an edge do not, and CLV is the test that tells them. If you are not tracking it, you are operating on faith.
Where to Go Deeper
Five focused articles do the deep mechanical work this pillar can only sketch. Each one expands a single market or framework into a 3,000-plus-word tactical guide. Treat them as the operational manuals; this pillar is the index.
Run line strategy
The full mechanics of -1.5 and +1.5, one-run-game data, alternate-line laddering, and when -1.5 actually beats the moneyline in expected value. Covered in the MLB run line strategy guide.
First five innings
The sharp market in detail — F5 moneylines, F5 totals, starter-quality filters, line-shopping at UK books, and the no-action rules that protect you on weather days. The first five innings betting guide is the dedicated treatment.
Starting pitcher analysis
FIP, xFIP, K-BB%, SwStr%, Statcast expected stats, platoon splits and how to weight recent form against career baselines. The MLB starting pitcher analysis deep dive carries the toolkit in full.
Kelly Criterion bankroll
Full, half and quarter Kelly worked through with realistic MLB price distributions, drawdown simulations, and UKGC-aware deposit patterns. The Kelly Criterion for MLB betting article carries the maths in full.
Park factors and weather
Park-by-park run and home-run multipliers, wind direction case studies, Coors and Sutter Health profiled in depth, and the totals framework that uses all of them. Covered in the MLB park factors and weather guide.
New punters should begin with the run-line strategy article and the Kelly bankroll guide — the markets you can punt and the staking that keeps you alive. Experienced punters with an edge already in mind should head straight for the starting-pitcher analysis and the park-factor article, because those are the inputs that build every system worth the name.
Betting Responsibly in the UK
I have spent more late nights than I would like watching a West Coast game I should not have been betting. The clock is part of the problem with MLB in the UK: a 22:10 BST first pitch for a Dodgers home game means the seventh-inning stretch arrives at 02:30, and the bullpen meltdown that swings your ticket happens when judgement is at its weakest.
The numbers are not abstract. UKGC and NatCen data put 21.9% of British adults aged 18–24 in the PGSI 1+ range — one in five in some level of gambling-risk territory, with around 5.3% in the higher 8–27 band. MLB is not the cause, but the combination of a 162-game schedule, late-night kick-offs and easy mobile betting is exactly the cocktail that can move a recreational punter into a problem pattern.
If you are betting more than you intended, betting to chase losses, hiding bets from family, or waking up at 3am to check a score — those are operational signals, not character failings. They are the same signals every clinical screening tool looks for, and easier to act on the earlier you spot them.
Every UKGC-licensed bookmaker offers deposit limits, loss limits, time-outs, reality checks and self-exclusion as standard. The deposit limit is the most useful single tool — set it before you ever feel the urge to raise it. Self-exclusion through GAMSTOP applies across every UKGC-licensed operator simultaneously. The charity GambleAware runs the national helpline.
A specific MLB rule that has saved me money and sleep: do not place bets after 22:00 GMT. Set the rules during the day, watch the late games for the cricket of it, let tomorrow’s slate be your action window. If a ticket cannot wait until tomorrow, it is not a system bet — it is a tilt bet, and tilt bets lose.
Frequently Asked Questions
Is MLB betting legal in the UK?
Yes. Any bookmaker licensed by the UK Gambling Commission may offer MLB markets to British residents. Legally it is identical to football or horseracing. The 2025–26 reforms apply to your account, not the sport. Confirm the operator’s licence number on the UKGC public register before opening any new account.
What is the run line in baseball and how does it differ from the moneyline?
The moneyline is a bet on which team wins outright; the run line bets whether the favourite wins by two or more runs, or the underdog wins outright or loses by exactly one. The handicap is fixed at 1.5 runs. Roughly 30% of MLB games finish with a one-run margin, the structural reason -1.5 favourite tickets feel like bargains and frequently are not.
What is a first five innings (F5) bet and why do sharp bettors use it?
An F5 bet settles on the score at the end of the top of the fifth inning. Sharp bettors favour it because it strips the bullpens out — relief pitching is the noisiest input in baseball. Superior starting pitchers win the F5 about 57% of the time versus 59% for the full game, but the F5 line is tight enough that effective expected value is usually better. Markets exist for moneyline, run line and totals at every serious UK book.
Do MLB betting systems actually work over a 162-game season?
Yes, when built around structural edges and staked with discipline. The 162-game schedule is large enough that genuine edges of 1–2% in expected value compound into meaningful returns. The systems that survive are filter-based: written entry rules, defined sizing, defined exit. Expect drawdowns of 20–30 tickets even from a working system — that is the cost of baseball variance, not a sign the system is broken.
How does the Kelly Criterion apply to MLB bankroll management?
Kelly is a stake-sizing formula: f* = (bp − q) / b. For MLB it is almost always used fractionally — half or quarter Kelly — because full Kelly assumes your probability estimate is exact and even good models carry estimation error. Quarter Kelly trades a small reduction in growth rate for a large reduction in drawdown risk. Regulatory benefit: small, even stakes are far less likely to trigger UKGC affordability checks at the £150 net-deposit threshold.
What time do MLB West Coast games start in the UK and how does that affect strategy?
West Coast games typically have 19:10 Pacific first pitch — 03:10 GMT in winter, 03:10 BST in summer. Most UK punters cannot watch live, meaning in-play bets are placed on stale information against books with live feeds. Lock in pre-game positions before 22:00 GMT, accept that live betting on West Coast games is a structural disadvantage, and check results in the morning.
How do the UKGC 2025–26 reforms affect MLB bettors?
The reforms apply to your account, not the sport. The light-touch financial vulnerability check triggers at £150 of net deposits over a rolling thirty-day window. The statutory levy on operator GGY went live 1 September 2025. Neither stops you betting MLB; both reward disciplined staking and steady deposit patterns. Size with fractional Kelly, deposit infrequently in modest amounts, avoid the patterns books are now algorithmically trained to flag.
The Edge Compounds, the Discipline Carries It
Everything in this playbook reduces to the same loop. Find a structural edge — F5, run line, underdog filter, park-and-weather totals. Define the entry rule in writing. Size with fractional Kelly. Track the closing line. Repeat several hundred times before you trust the result. Nothing in that loop any UK punter cannot do, nothing any UK regulator objects to.
What has changed across the eight years I have been doing this is not the maths. The maths is older than I am. What has changed is the market around the maths — bigger, more visible, more British. Chris Marinak, MLB’s Chief Operations and Strategy Officer, told the Associated Press the league has «clearly identified the UK as a priority market and an area that we plan to emphasise for international growth». When the league itself is leaning in, the broadcast deals follow, the data feeds follow, and the betting depth at British books follows.
The edge is real. The variance is also real. Discipline is the only tool that converts the first into bank without letting the second take it back.
Pick one cluster article from the five linked above, build a system inside its boundaries, stake it through a full season. Then pick the next. That is how serious punting is built — one system at a time, audited honestly, scaled only when the data permits. The shortcut does not exist. The compounding does.
Creado por la redacción de «mlb Betting Systems».